Infographics: the Most Loved Marketing Tool for Technology

Smart Buildings readily integrate LoRaWAN(R) into new, modern, and legacy buildings without wires or construction and over a single network.
I feel that pictures are one of the most meaningful ways to peak people’s interest in unknown topics. This especially is true for technology; while there are plenty of technical diagrams, there are very few contextual images that make technology relatable. Who should use a certain technology and for which applications? What are the tangible benefits? Everyone says a connected world is better, but what does that mean across industries?
Like all marketing projects, infographics must start with the designated audience in mind. The first infographic I worked on at the LoRa Alliance was with the Smart Agriculture Work Group. While the end-users they want to target are farmers, this infographic was designed for agribusinesses who sell to farmers to use as a tool to explain LoRaWAN®. The key message was, “Insights you never had, affordably,” and the image shows how even in remote locations, LoRaWAN maintains connectivity.
After taking part in many conversations with businesses across the LoRaWAN value chain for smart agriculture, I sketched up an idea for the infographic that was a jumping off point for future discussions that ultimately yielded the final draft I developed with a graphic designer.


Having the Smart Ag infographic under my belt, it was much easier to create the Smart Cities infographic. Here, the audience was the difficult-to-define “city manager.” We assumed this person is a decision maker or budget director that didn’t necessarily understand the nuts and bolts of technology but sought innovation. A graphic is a great way to reach this segment of the market without drowning them in technical jargon.
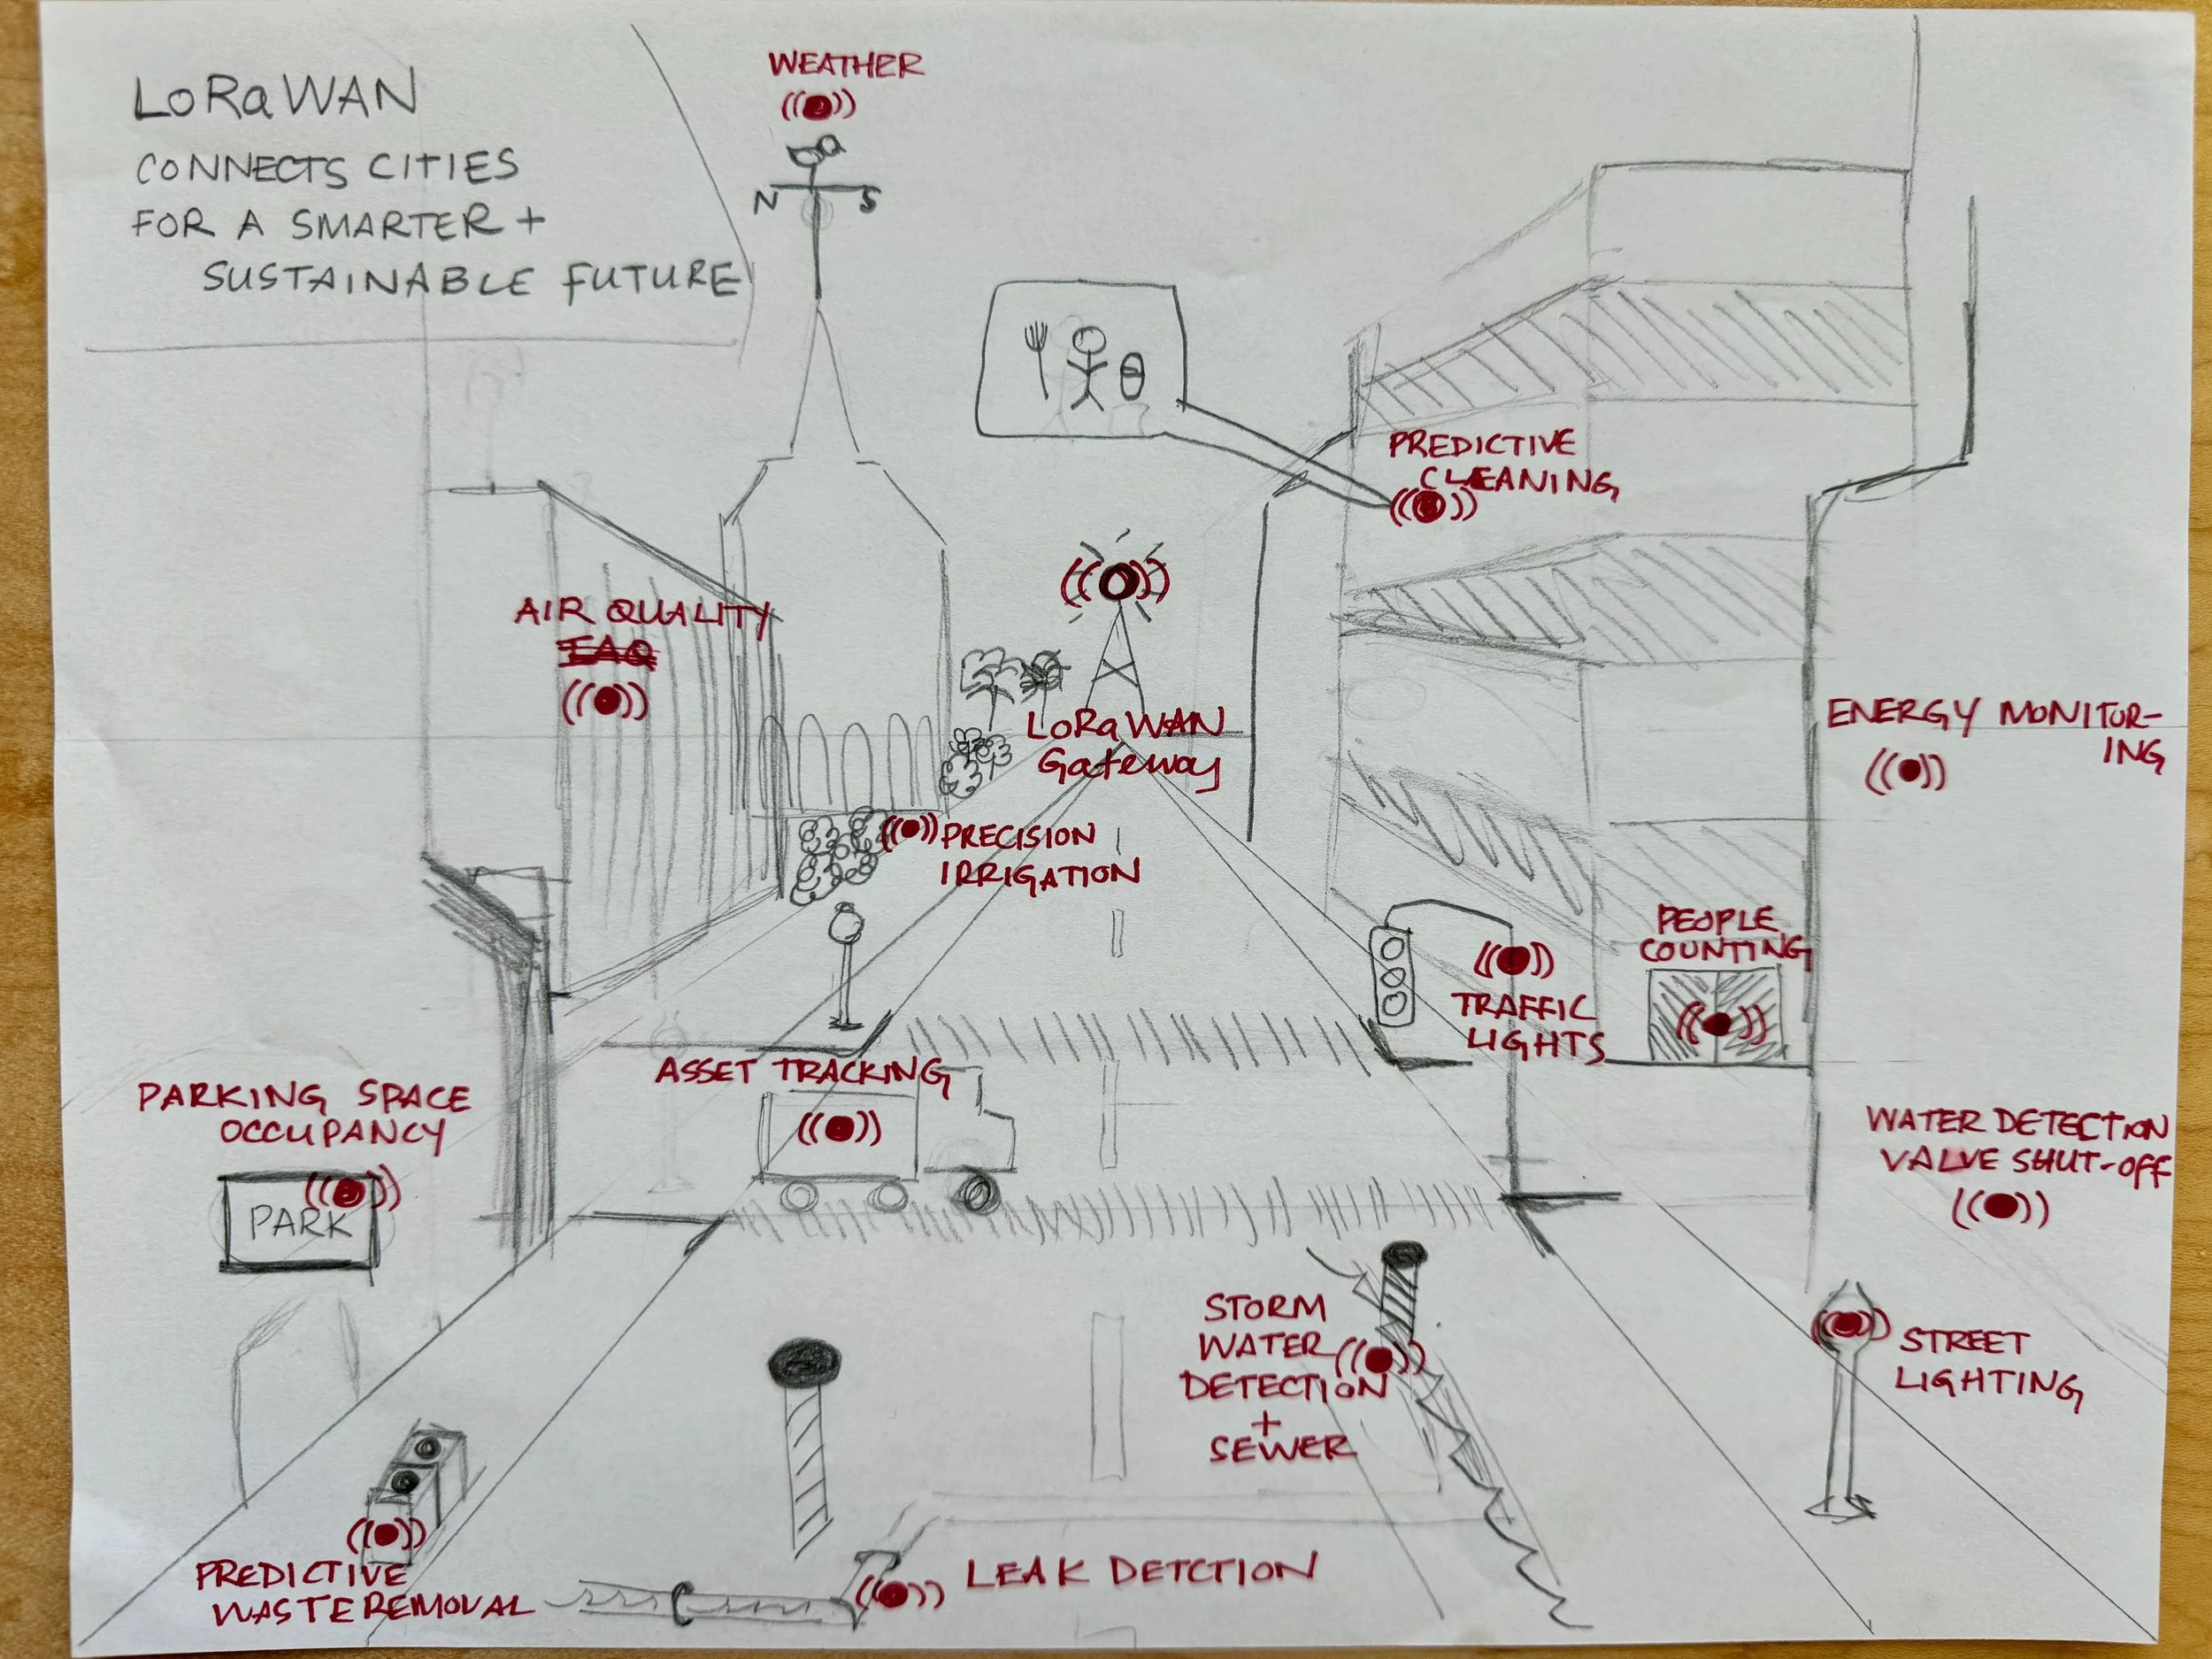

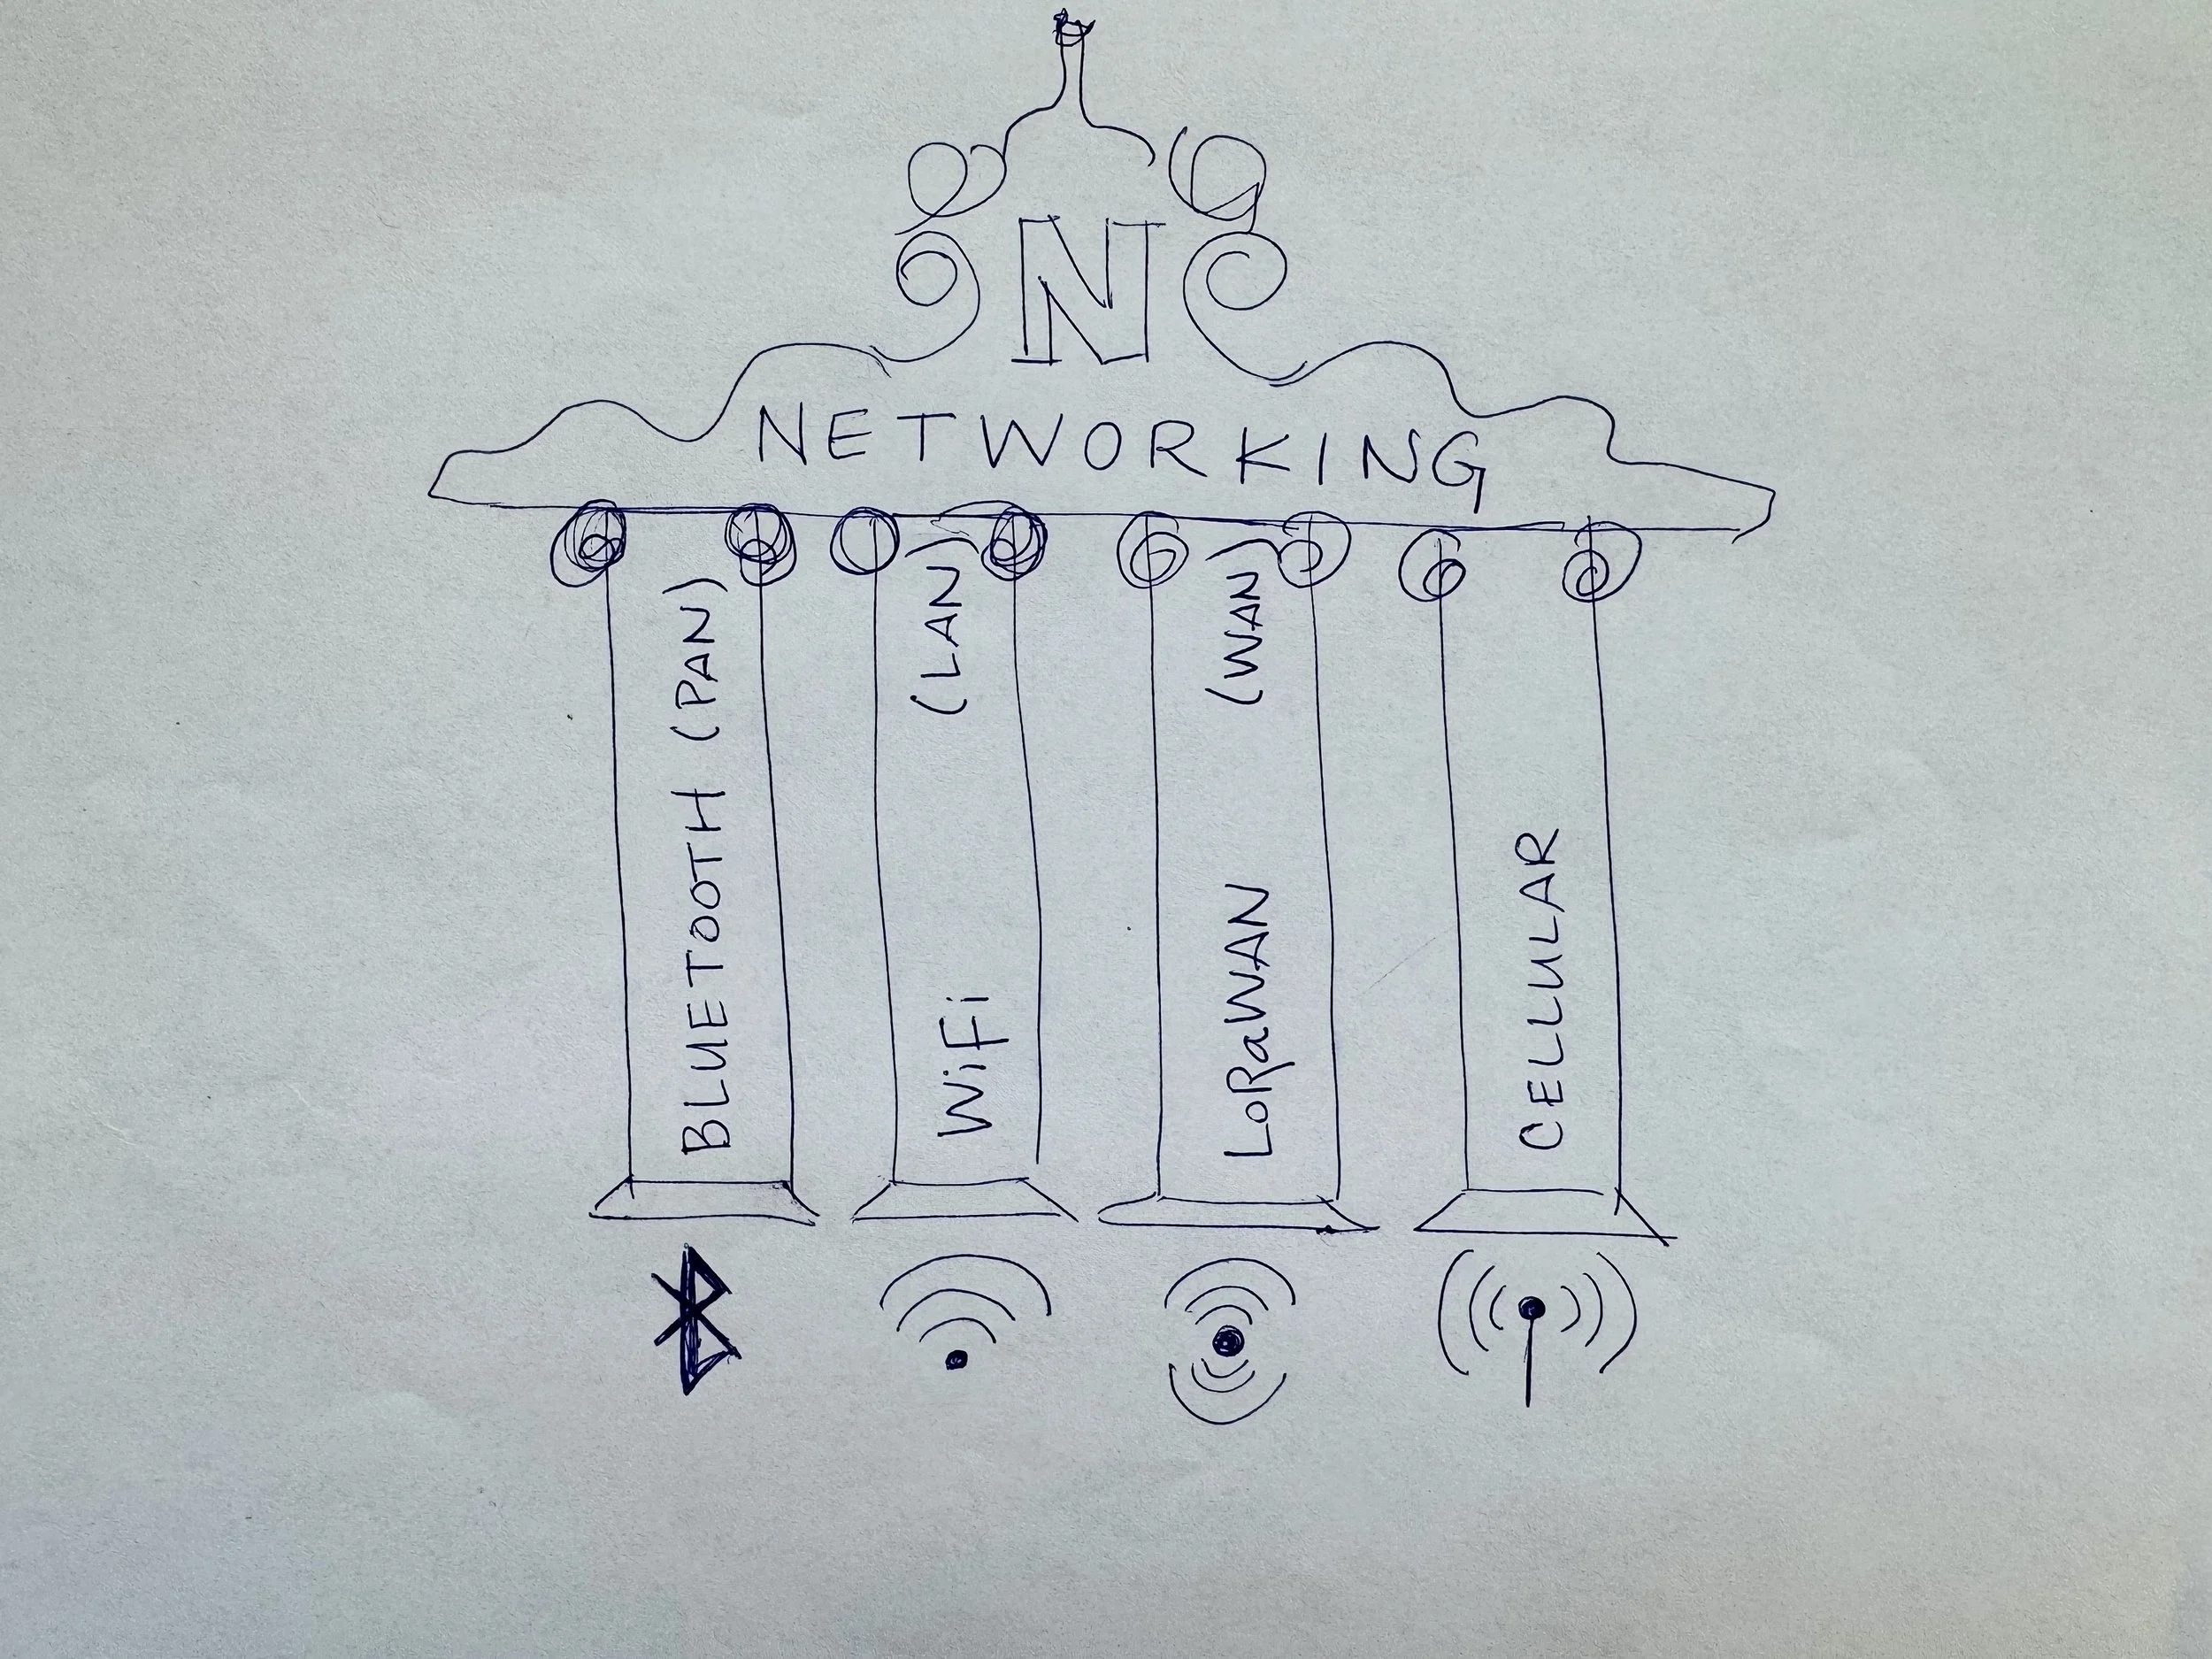
Smaller ideas are also worthy of graphics. For instance, “The 4 Pillars of Networking,” is a graphic I constantly refer to in my memory. When discussing the Internet of Things and networks and connectivity, if your field isn’t technical, it’s a bit difficult to sort out how the pieces fit together. I find it extremely helpful to recall that the 4 pillars are Personal Area Networks, Local Area Networks, Wide Area Networks, and Cellular, because from there, I can remind myself how to differentiate Bluetooth, WiFi, LoRaWAN (and others), and 5G.

Here's another tip about graphics: everyone loves them. My infographics drive activity on LinkedIn and websites, where numerous likes move posts high on news feeds and the content generates the most click-throughs on websites. People love to share them, re-use them, add them to articles, print them for booth graphics, incorporate them into their own websites, and add them to sales materials. Infographics are relatable and reusable materials that are worth every penny you spend on them.
Please reach out if you think there’s a technology concept that needs an infographic. I have a couple ideas going and am always looking for more.
Cheers,
Brenna